


Nicholas Benzor
Principal Planner & Chief Executive Officer

Sanskar Raheja
Financial Analyst
Table of Contents
- First-Half Market Overview
- U.S. Equities
- Sector Performance
- International Equities
- International vs U.S. Equities
- Fixed Income
- Treasuries and the Yield Curve
- Commodities & Precious Metals
- Inflation and Labor Market
- GDP, Consumer Health, and Housing
- Fed Policy and Rate Expectations
- Geopolitics and Policy Risk
- Closing Message
2026 Mid-Year Market Commentary
Benzor Capital Wealth
First-Half Market Overview
The first half of 2026 has been broadly constructive for risk assets, with equity markets delivering positive total returns despite continued uncertainty around interest rates, inflation, valuations, and geopolitical risk. The strongest performance has come from small caps, growth-oriented U.S. equities, and broad international equities, while fixed income returns have remained muted.
First-Half 2026 Market Performance
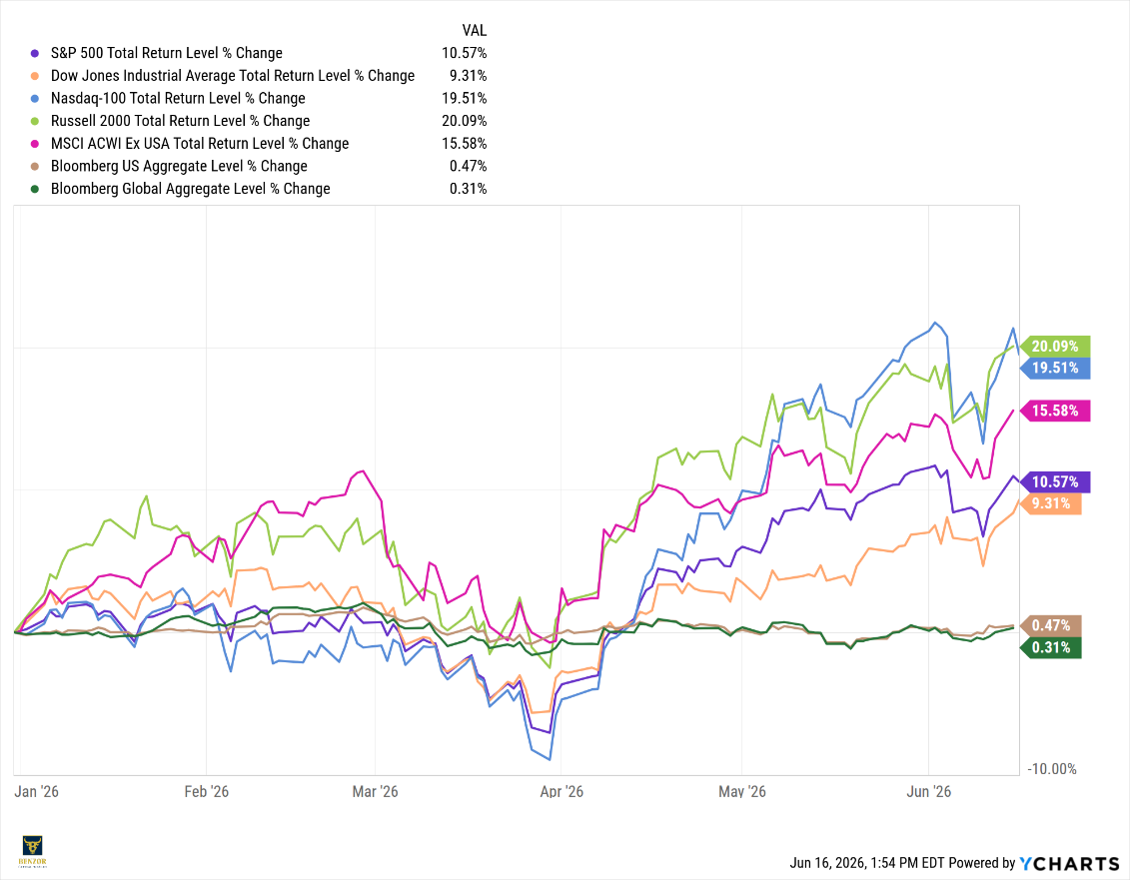
The first-half performance picture shows a clear separation between equities and fixed income. Equity markets broadly advanced, led by the Russell 2000’s and the Nasdaq-100’s gain. Investors were willing to take risk, rewarding both smaller companies and growth-oriented businesses tied to technology, artificial intelligence, semiconductors, and stronger earnings expectations. International equities also made a meaningful contribution, with MSCI ACWI ex-USA outpacing the S&P 500 over the same period.
Fixed income was comparatively flat. Bonds continued to provide income and diversification, but changing rate expectations and Treasury yield volatility limited upside. The fixed-income result highlights one of the key contrasts of the first half: yields were attractive enough to support income but not strong enough to generate returns.
U.S. Equities
U.S. equities delivered strong first-half results, supported by resilient earnings, continued enthusiasm around artificial intelligence and technology, and improving participation across a broader range of market segments. While large-cap growth remained an important driver of returns, performance was not limited only to the largest U.S. companies. Small caps also delivered strong gains, indicating that investor risk appetite remained healthy and that market leadership may be broadening.
U.S. Equity YTD Performance
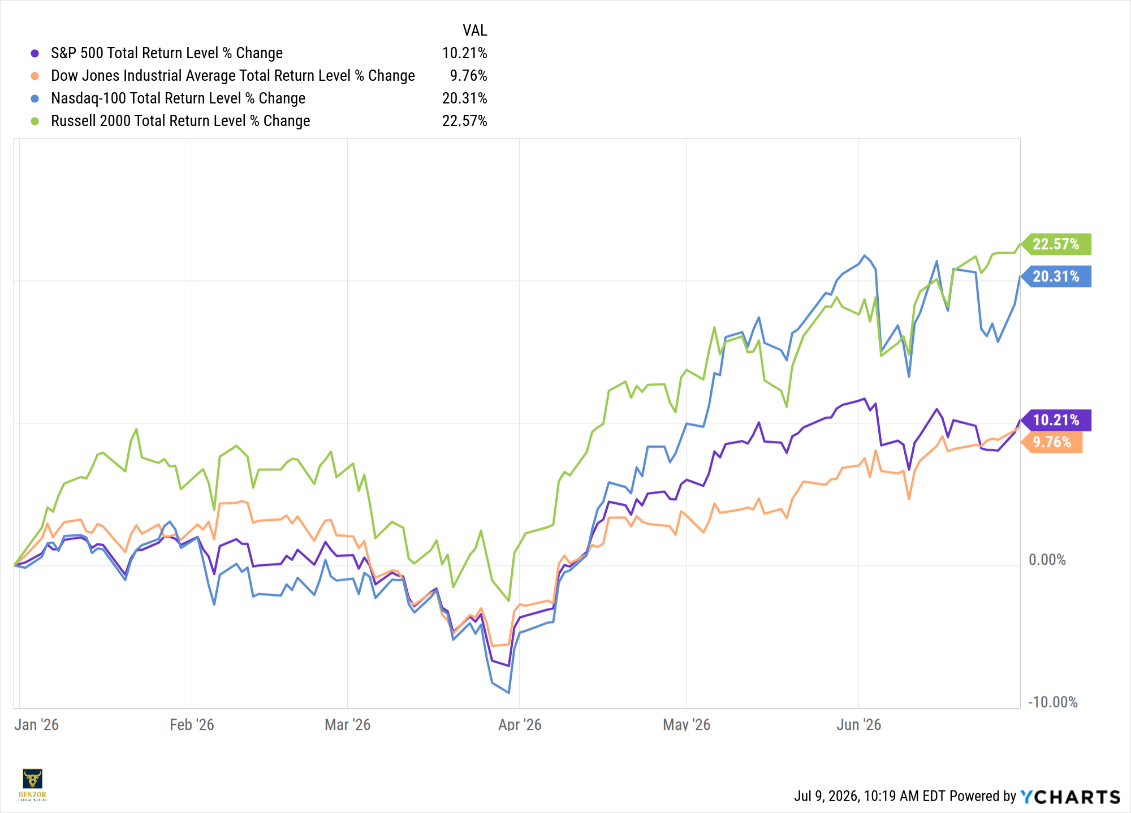
The first-half return profile shows that U.S. equities remained one of the strongest-performing major asset classes. The Nasdaq-100 returns reflect continued investor preference for technology, artificial intelligence, semiconductors, and companies with strong earnings visibility. This was consistent with the dominant market theme of the past year: investors continued rewarding businesses tied to innovation, infrastructure spending, and long-term structural growth. The important point is that Nasdaq leadership was not simply about investors chasing growth broadly; it was more specifically tied to companies positioned around AI infrastructure, computing demand, and durable earnings visibility. A relatively small set of chip and semiconductor-equipment companies, names tied to memory, processors, and the hardware layer of AI data-center build-outs, accounted for a disproportionate share of the market’s total return.
At the same time, one of the more important developments in the first half was the performance of small caps. The Russell 2000 led the major U.S. indexes shown. This is significant because the rally broadened beyond large-cap technology and into more economically sensitive and domestically oriented businesses. The two clearest drivers were valuation and the AI supply chain. Small caps entered the year at one of their widest valuation discounts to large caps in decades, and the same AI-infrastructure spending that supported large-cap technology began flowing down to smaller suppliers, particularly small-cap semiconductor and equipment companies, several of which posted triple-digit gains. A stronger M&A backdrop, especially in biotech and healthcare, added further support.
The S&P 500 also posted a strong total return, reinforcing that U.S. large-cap equities remained supported by solid corporate fundamentals and continued investor confidence. Although the S&P 500 lagged the Nasdaq-100 and Russell 2000, its gain still reflects a healthy market environment in which investors remained willing to pay for quality earnings, strong balance sheets, and companies with pricing power or durable competitive positioning. The Dow Jones Industrial Average is trailing the other major U.S. equity benchmarks.
Two broader signals reinforced how much market leadership shifted. First, the rotation from growth to value was substantial: large-cap value materially outperformed large-cap growth, a sharp reversal of the pattern that defined 2024 and 2025 and a direct consequence of the mega-cap leaders stalling. Second, the equal-weighted S&P 500 outperformed the traditional cap-weighted S&P 500, meaning the average stock did better than the index dominated by its largest members. Both are signs of genuinely broader participation: the rally was carried by more of the market, not a narrow group of mega-caps.
The next layer of analysis is sector leadership. Index-level returns show that U.S. equities were broadly positive, but they do not fully explain what drove performance underneath the surface. The sector breakdown is necessary because it shows whether the rally was truly broad-based or concentrated in specific themes such as AI infrastructure, semiconductors, energy, and cyclicals.
Sector Performance
While broad U.S. equity indexes delivered positive first-half returns, sector performance shows a more detailed picture of what actually drove the market. The rally was not evenly distributed across all parts of the market. Leadership was concentrated in Technology, Industrials, Energy, and Materials, while several major sectors lagged despite positive index-level performance.
S&P 500 Sector Performance: First-Half 2026
- Technology was the clear sector leader. This aligns with the broader first-half market narrative: investors continued rewarding companies tied to artificial intelligence, semiconductors, data centers, cloud infrastructure, and durable earnings growth.
- Industrials were the second-best-performing sector. This is important because it shows that the rally was not only a technology and energy story.
- Energy remains one of the strongest sectors. The sector remained an important contributor because Middle East tensions and Strait of Hormuz risk kept oil markets highly sensitive to policy and geopolitical developments.
- Materials also delivered a strong return. Together with Industrials, Materials supports the view that cyclical sectors participated meaningfully in the first-half rally.
- Real Estate, Consumer Staples and Utilities participated positively, but they lagged the strongest growth and cyclical areas. Real Estate’s positive return shows that selected rate-sensitive areas recovered despite elevated yields, while Staples and Utilities reflected steadier, more defensive participation rather than market leadership.
- Health Care gained, moving into positive territory, but still lagging the broader market. The sector’s modest gain shows that defensive exposure participated, but not strongly enough to keep pace with areas tied to AI, commodities, or cyclical growth.
The weakest sectors were Communication Services, Financials, and Consumer Discretionary. Communication Services declined, making it the clear laggard. Financials declined, while Consumer Discretionary fell. The sector breakdown shows that the first-half equity rally was driven by a combination of secular growth, cyclical strength, and commodity-linked performance. The rally had more breadth than a narrow technology-only market, but it remained highly selective. Strength across Technology, Industrials, Energy, Materials, Real Estate, Staples, Utilities, and Health Care shows that most sectors were positive. At the same time, the wide gap between Technology’s gain and Communication Services’ decline highlights the importance of sector allocation and underlying exposure.
International Equities
International equities made a meaningful contribution during the first half of 2026, reinforcing that the equity rally was not limited to U.S. markets.
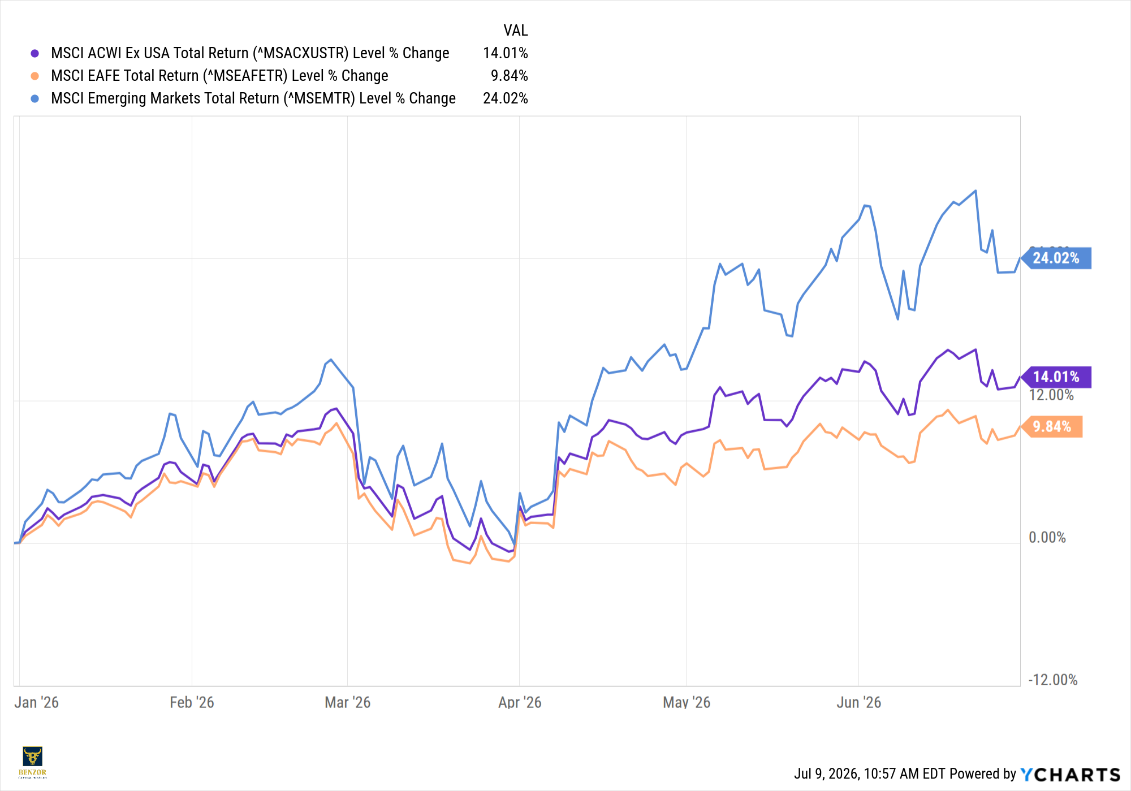
International Equities: First-Half 2026 Performance
Source: YCharts.
The first-half international equity data shows a clear performance hierarchy with emerging markets leading significantly.
The strength in emerging markets was one of the most important developments in the first-half global equity picture. Emerging markets are often more sensitive to global growth expectations, currency movements, capital flows, commodity demand, and regional technology cycles.
Developed international markets also contributed positively, though returns were more moderate than those of emerging markets. MSCI EAFE’s gain shows that developed non-U.S. equities participated in the broader rally, supported by valuation appeal, currency dynamics, and improving investor interest in global diversification.
Broad International Exposure Added Value
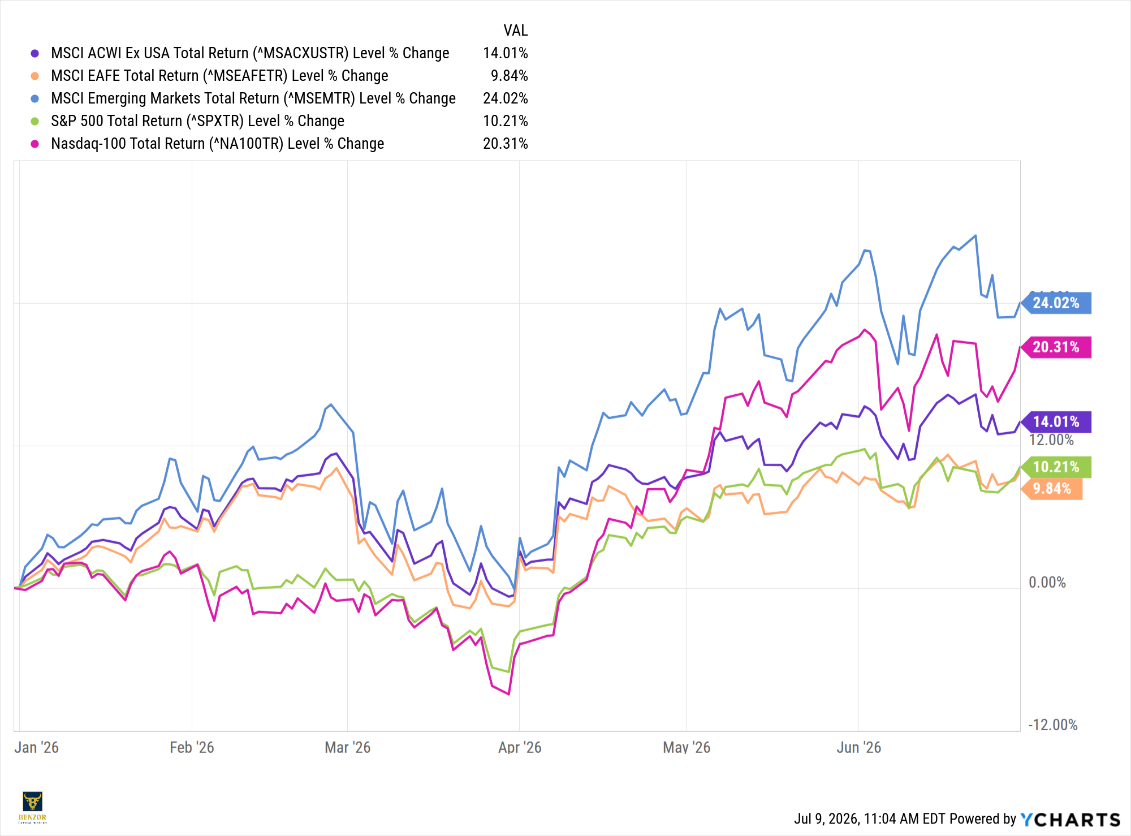
MSCI ACWI ex-USA returns show that broad international equity exposure was not simply a diversifier during the first half; it was a meaningful contributor to return. This is important because international equities have often lagged U.S. equities in prior periods, causing many investors to question the role of non-U.S. allocations.
The chart also shows that international markets followed a similar pattern during the first half. Performance improved early in the year, weakened during the March-to-early-April period, and then recovered sharply into May and June. This rebound suggests that international equities benefited from improving risk appetite after early-year volatility, with emerging markets showing the strongest recovery and the most upside.
Developed vs. Emerging Markets
The difference between developed and emerging market performance was significant. This gap shows that international equity performance was not evenly distributed. Emerging markets provided the strongest contribution, while developed international markets delivered steadier but more moderate gains.
This distinction matters for portfolio analysis. A broad international allocation can provide diversified non-U.S. exposure, but the drivers of return can differ meaningfully between developed and emerging markets. Developed markets are often influenced by valuation, currency movement, interest rates, and sector composition. Emerging markets may be more directly tied to global growth, commodity cycles, currency trends, and regional technology or manufacturing exposure.
The first-half performance also supports a deeper review of Asia and technology-linked emerging markets. Areas connected to semiconductors, memory demand, manufacturing, and global supply chains were particularly relevant as investors continued looking for beneficiaries of AI infrastructure and computing demand outside the U.S.
International Equities VS U.S. Equities in the First Half
Source: YCharts
U.S. Equities Continue to Trade at a Valuation Premium
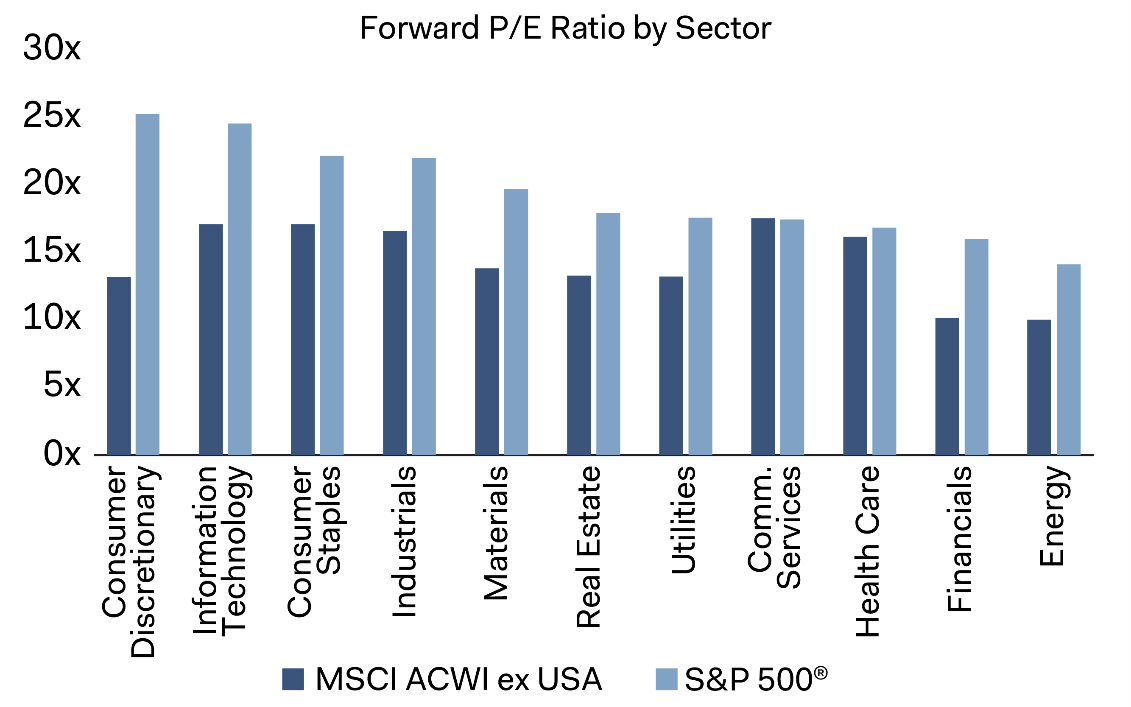
Source: Dodge & Cox, “The Case for International Equities.” Valuation data as cited in the report.
The valuation gap does not automatically mean international equities will outperform, but it does make the international discussion more relevant. A lower valuation starting point can improve the forward-looking opportunity set, particularly if earnings growth, currency trends, investor flows, and regional fundamentals become more supportive.
Another reason international exposure deserves attention is concentration risk. The U.S. equity market has become increasingly dependent on a small group of large companies, while international indexes remain more diversified across companies, regions, and sectors.
U.S. Market Leadership Remains More Concentrated
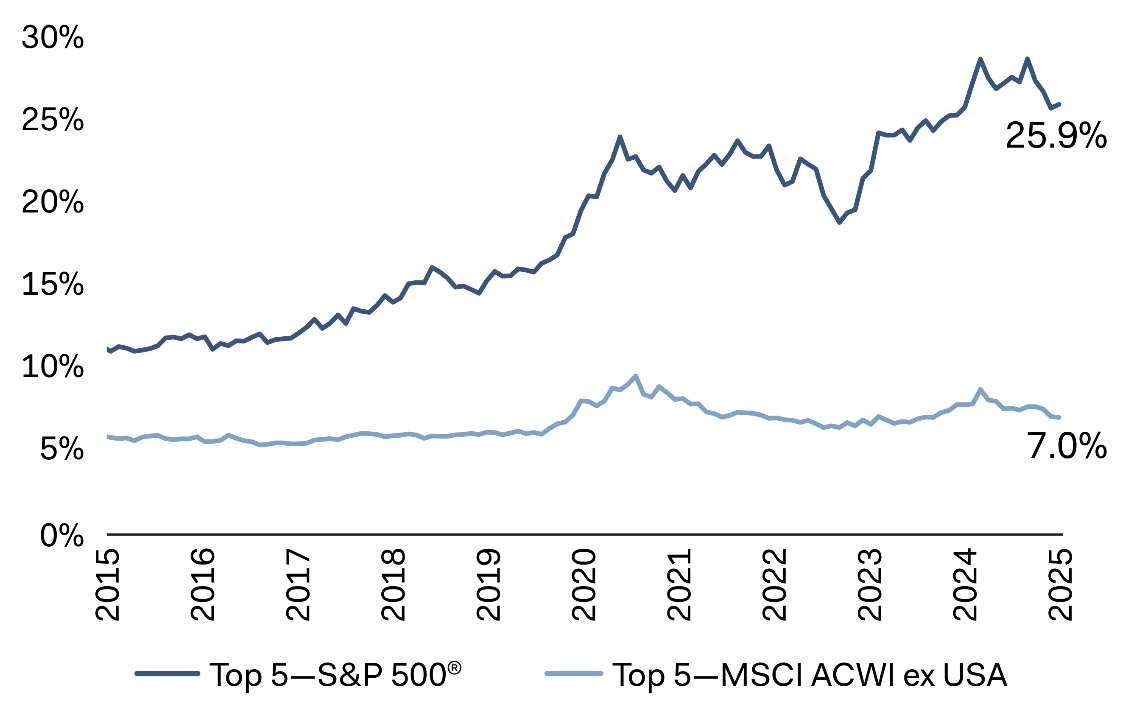
Source: Dodge & Cox, “The Case for International Equities.”
Fixed Income
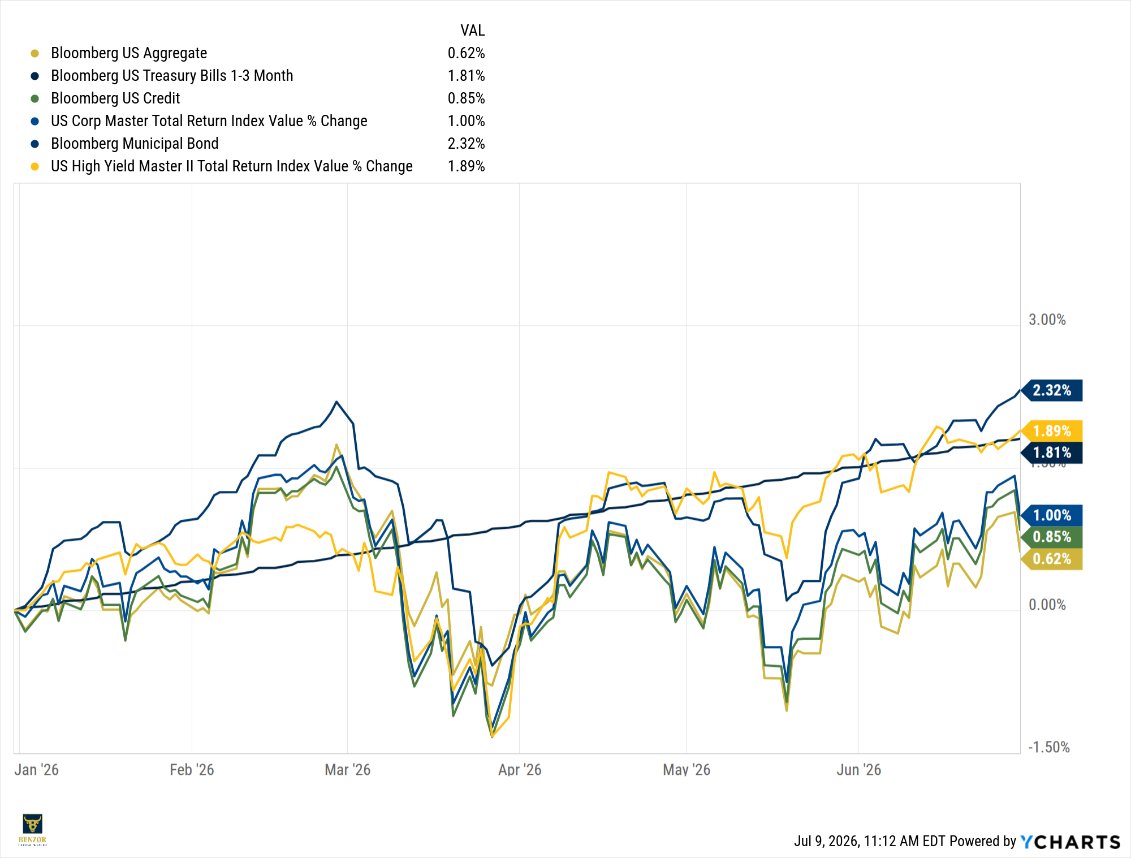
Fixed income delivered positive but modest first-half returns compared to equities, as interest rate volatility continued to limit price appreciation across core bond exposures. Starting yields remained attractive, but total returns were still muted because bond markets continued to adjust to inflation expectations, Federal Reserve policy expectations, and Treasury yield movements.
Fixed Income Performance: First-Half 2026
Source: YCharts
The first-half fixed income data show that bond returns were positive, but limited, reflecting the challenge core bonds faced as the future of interest rates remained volatile. Broad, high-quality bond exposure continued to provide stability and income, but price appreciation remained constrained by Treasury yield movements.
The key driver of fixed income performance during the first half was the tension between income and duration risk. Higher yields provided a better starting point for bond investors, but bond prices remained sensitive to changes in Treasury rates and Fed expectations. As a result, income carried fixed income returns, while price appreciation remained limited.
Treasuries and the Yield Curve
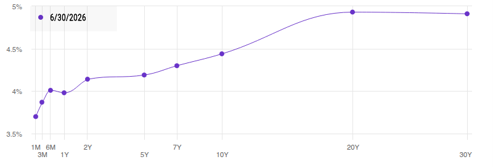
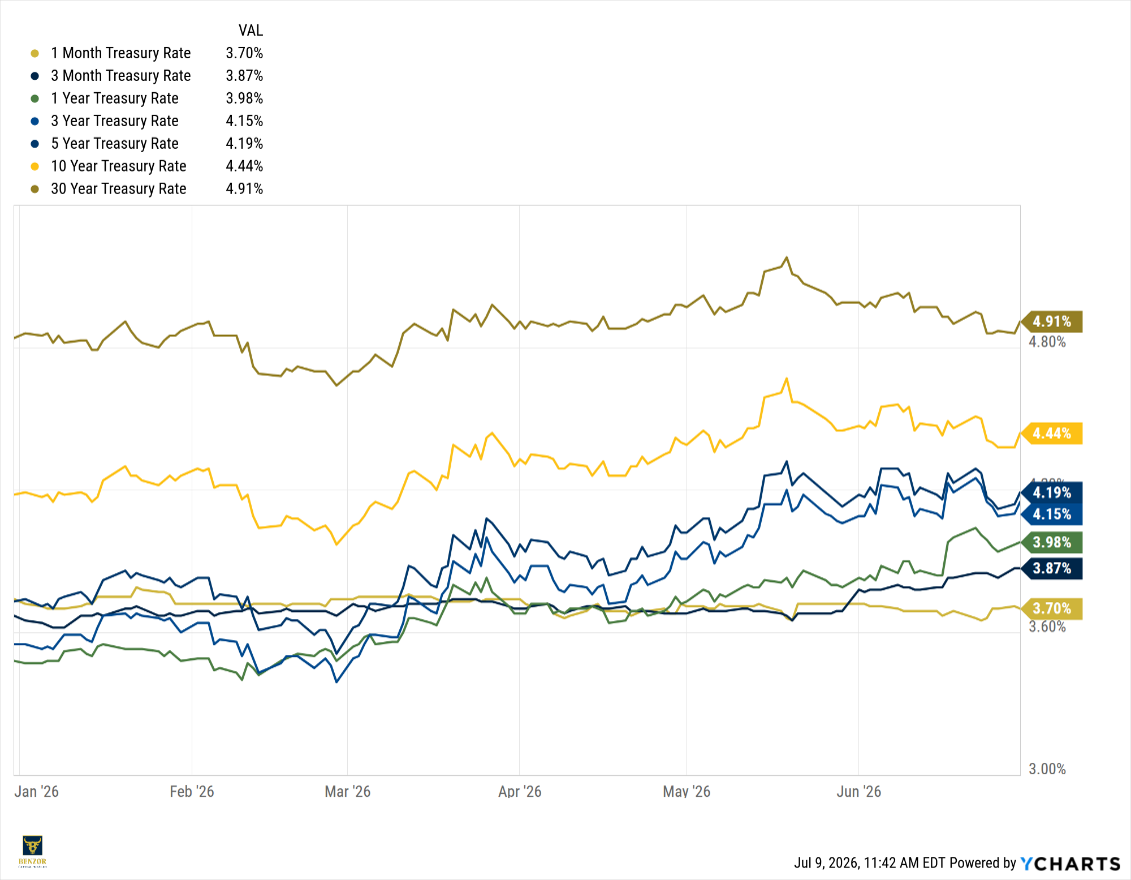
Treasury markets remained a central driver of fixed income performance during the first half of 2026. While short-term rates stayed elevated, longer-term Treasury yields also remained high, keeping pressure on duration-sensitive bonds. The yield curve reflected a market still balancing inflation uncertainty, Federal Reserve policy expectations, fiscal concerns, and demand for longer-term bonds.
Treasury Yield Curve Snapshot
Source: YCharts
Treasury Yields Remained Elevated Across the Curve
Source: YCharts
Treasury yields were one of the main reasons core fixed income returns lagged equities during the first half. The income component of bonds was positive, but price returns were limited because yields remained volatile and long-term rates stayed elevated.
The Treasury market also helps explain the difference between short-duration and long-duration performance. Short-duration fixed income benefited from elevated yields and lower price sensitivity, while longer-duration bonds faced more pressure from movements in the 10-year and 30-year Treasury yields.
Commodities & Precious Metals
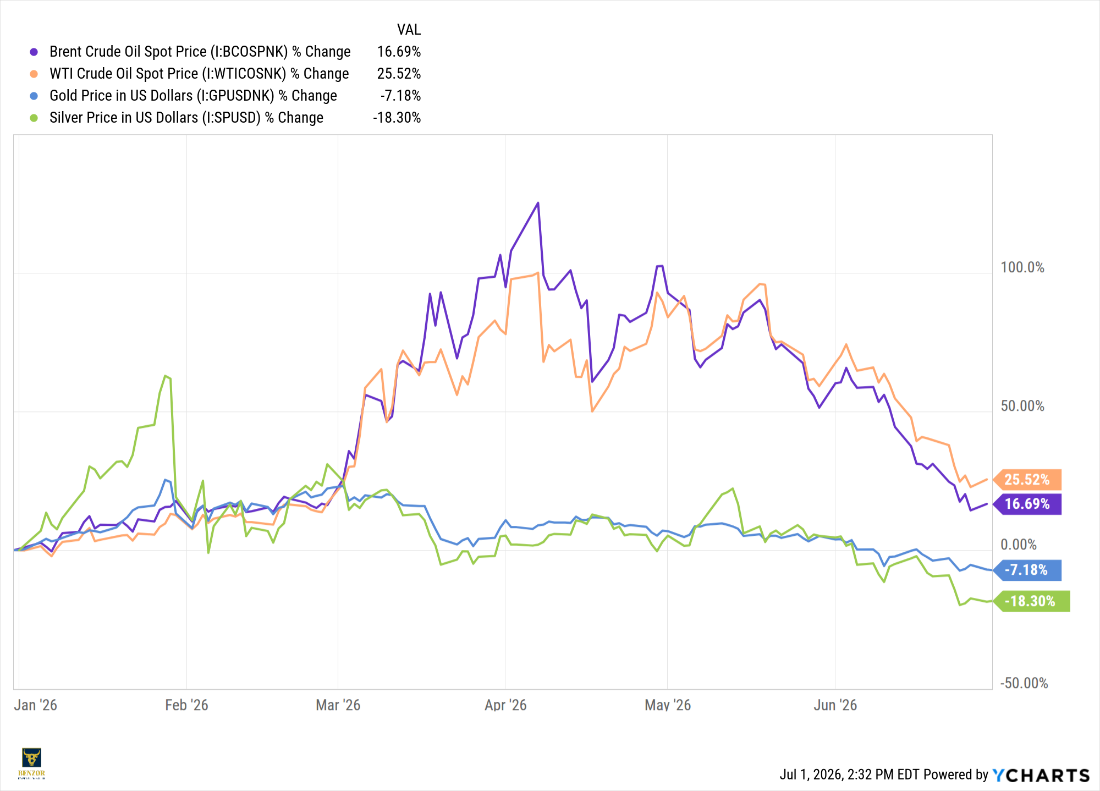
Commodities delivered a split first-half picture. Oil was the clear leader, while gold and silver finished negative. This shows that the commodity story was not a broad hard-asset rally or a simple inflation-hedge trade.
Commodities & Precious Metals: First-Half 2026 Performance
Source: YCharts.
Oil’s first-half performance was driven by the Iran conflict and the risk of disruption through the Strait of Hormuz, one of the most important chokepoints for global energy flows. As the conflict escalated, markets priced in the possibility of restricted tanker movement, tighter crude supply, and higher energy costs.
That matters for inflation. Oil is one of the fastest ways geopolitical risk moves into the economy because it affects gasoline prices, transportation costs, input costs, and inflation expectations. The earlier spike increased the risk of renewed inflation pressure
Gold and silver told a very different story. Both precious metals declined even though the first half included geopolitical uncertainty and inflation concerns. That shows investors were not broadly rotating into traditional safe-haven assets. Instead, capital continued moving toward risk assets, particularly equities tied to earnings growth, AI infrastructure, and stronger market momentum.
Inflation and Labor Market
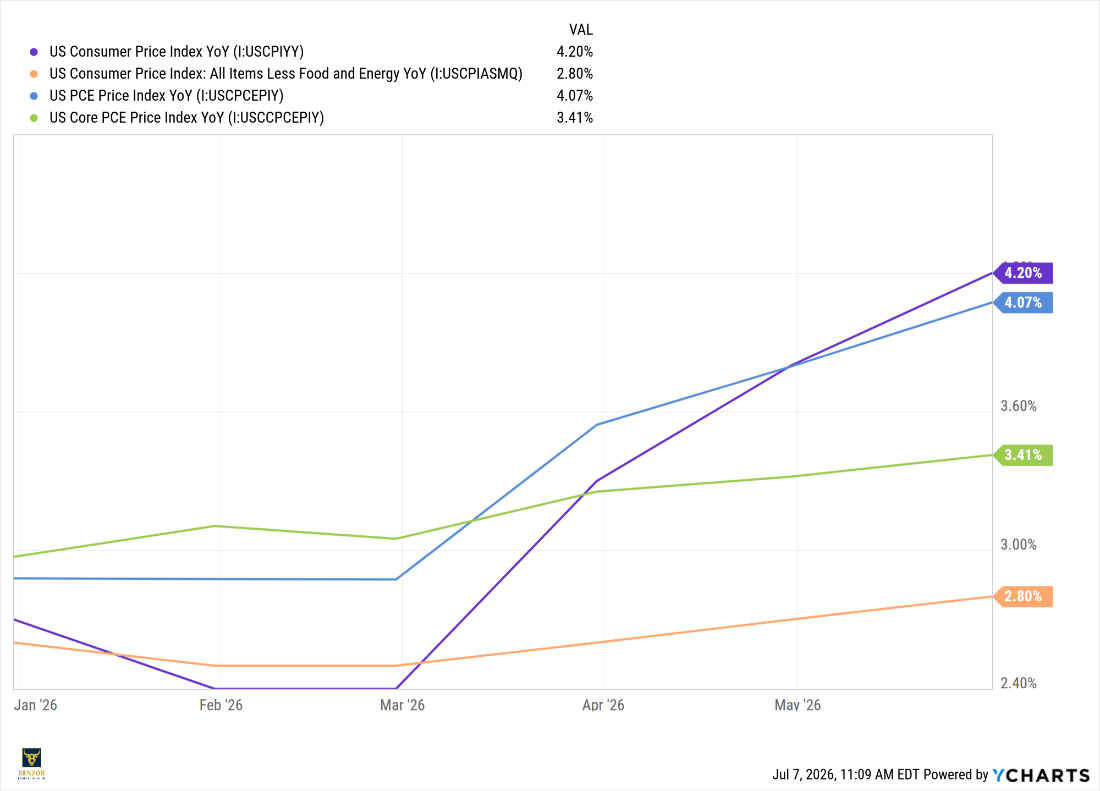
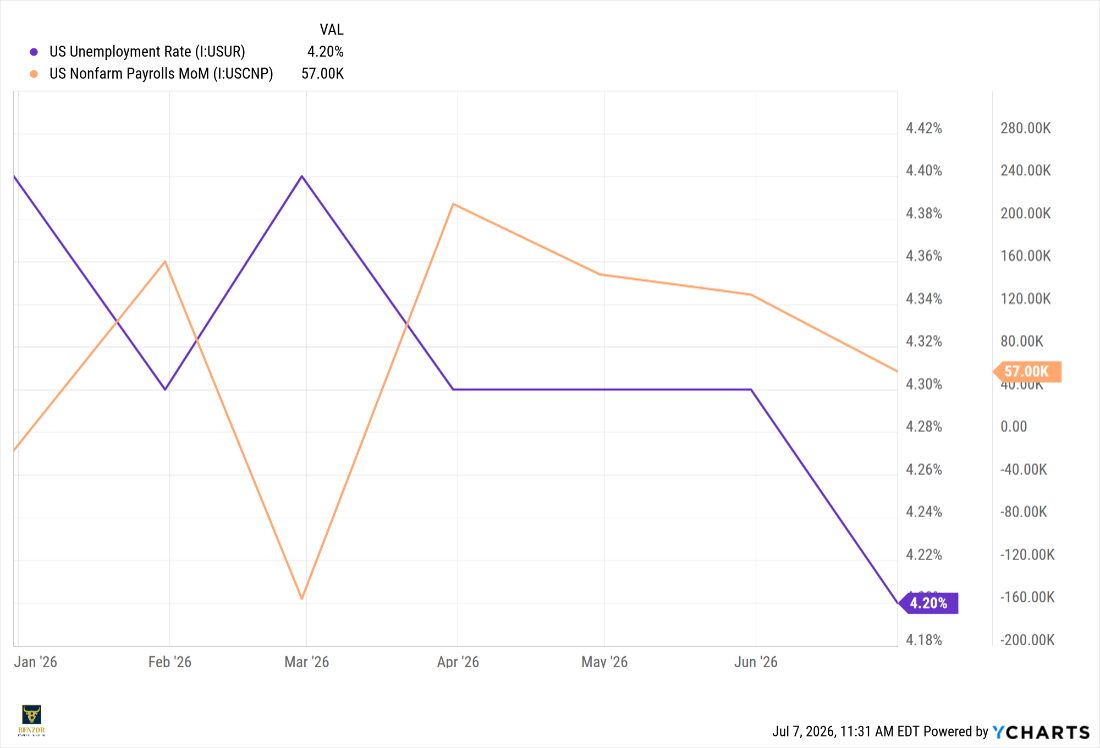
The macro backdrop remained difficult for the Fed because inflation and labor data moved in different directions. Inflation reaccelerated during the first half, while the labor market cooled through slower hiring. That combination did not give policymakers a clean signal. Inflation remained too high to support aggressive easing, but labor conditions were not weak enough to force an immediate policy response.
Year-over-year inflation measures through latest available reading
Source: YCharts
The inflation chart shows two important points. First, headline inflation moved sharply higher, reflecting the impact of energy and other volatile components. The Iran conflict and Strait of Hormuz disruption pushed oil prices higher earlier in the year, and energy remains one of the fastest channels through which geopolitical risk flows into consumer prices. Second, the core measures did not rise as sharply as headline inflation, but they remained above the Fed’s 2% objective.
The difference between CPI and PCE also matters. CPI captures the consumer-facing price experience more directly, especially out-of-pocket categories such as shelter and everyday expenses. PCE is the Fed’s preferred inflation measure because it uses a broader consumption basket and adjusts spending weights more dynamically. The fact that both CPI and PCE remained elevated tells the same broad story: inflation was no longer improving fast enough to give the Fed confidence that price stability had been restored.
Labor Market Cooling, Not Cracking
Source: YCharts.
Labor market data moved in the opposite direction. Hiring slowed into June, but unemployment remained contained. This is the key distinction. The labor market cooled through weaker job creation rather than a broad layoff cycle
This created a difficult policy mix. Inflation was too high, and labor was cooling but not collapsing. For the Fed, that supports patience rather than urgency. For markets, it means each inflation and employment release carries more weight because the next policy move depends on whether inflation cools before labor weakness becomes more serious.
AI also belongs in the labor discussion, but it should be framed correctly. AI is changing labor demand before it changes aggregate unemployment. The early impact is showing up in job design, skills demand, productivity expectations, and hiring selectivity. Companies are demanding more workers who can use AI tools, manage data, validate outputs, and redesign workflows
AI has not yet produced a broad unemployment shock. The transition is real, but it is gradual.
GDP, Consumer Health, and Housing
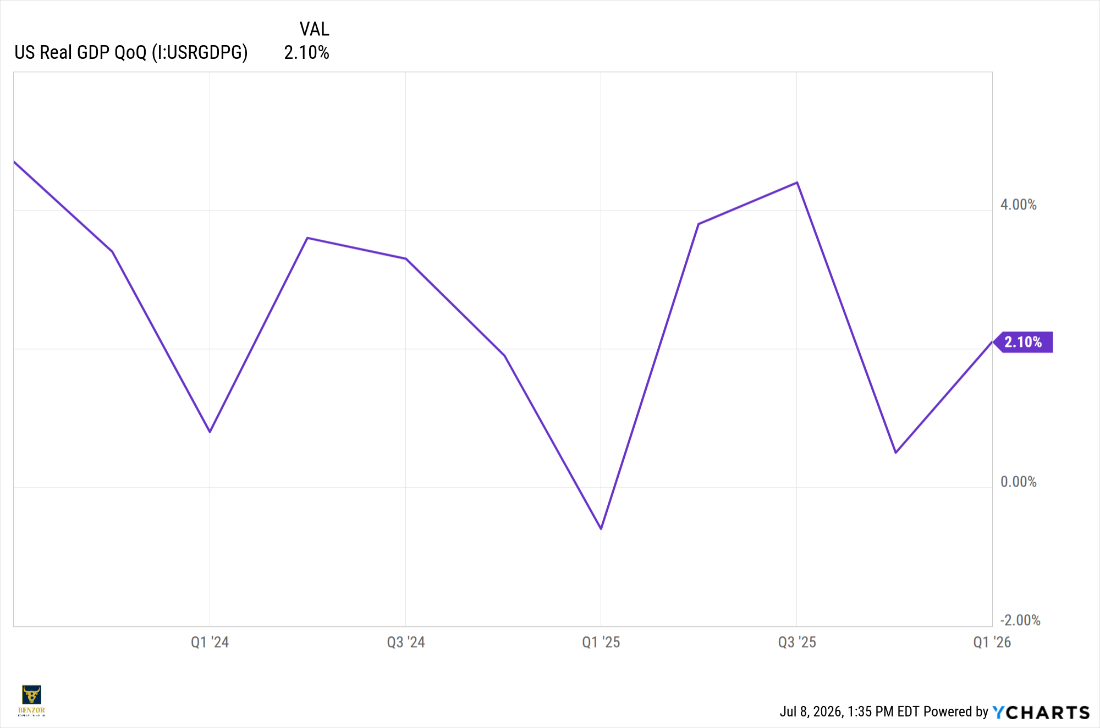
The U.S. economy remained resilient in the first half, but the underlying picture was uneven. Real GDP rebounded in the first quarter, confirming that the economy was still expanding. The rebound was supported by investment, exports, government spending, and consumer spending.
GDP Rebounded, but Growth Remained Moderate
Source: YCharts
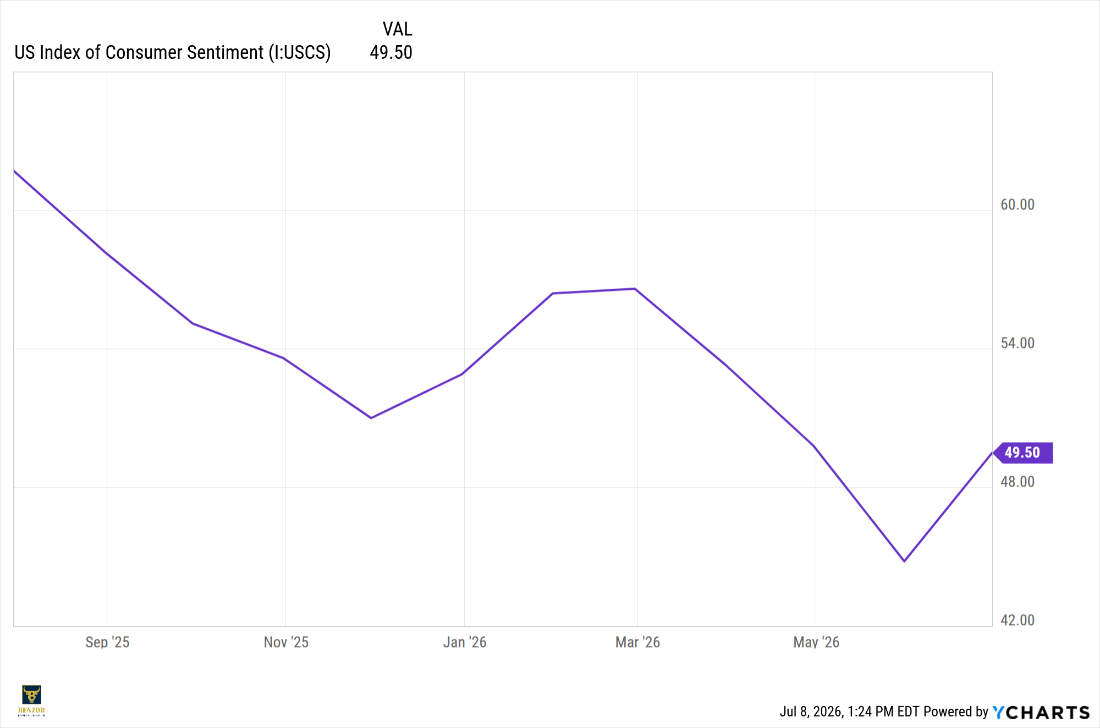
GDP growth showed resilience, but the consumer backdrop was less clean. Consumers continued spending, yet sentiment remained weak.
Consumer Sentiment Remained Weak Despite Positive Growth
Source: YCharts
The consumer is not weak in aggregate, but the strength is uneven. Higher-income households continued to drive a meaningful share of spending because they had stronger balance sheets, better access to credit, higher savings buffers, and greater exposure to equity-market gains. Lower- and middle-income households remained more exposed to higher prices for essentials, including food, shelter, fuel, utilities, insurance, and healthcare. This created a K-shaped consumer environment: spending continued, but financial pressure was not evenly distributed.
The Walmart versus Whole Foods dynamic is a useful way to explain the consumer split. Walmart strength reflects broad value-seeking behavior. Consumers are still spending, but they are looking harder for price, convenience, and grocery value. Importantly, value-seeking is no longer limited to lower-income households; higher-income consumers are also using value retail. At the same time, premium grocery and prepared-food demand show that higher-income consumers are still willing to spend when the purchase offers convenience, quality, health, or time savings. The consumer did not stop spending. The consumer became more selective.
Housing
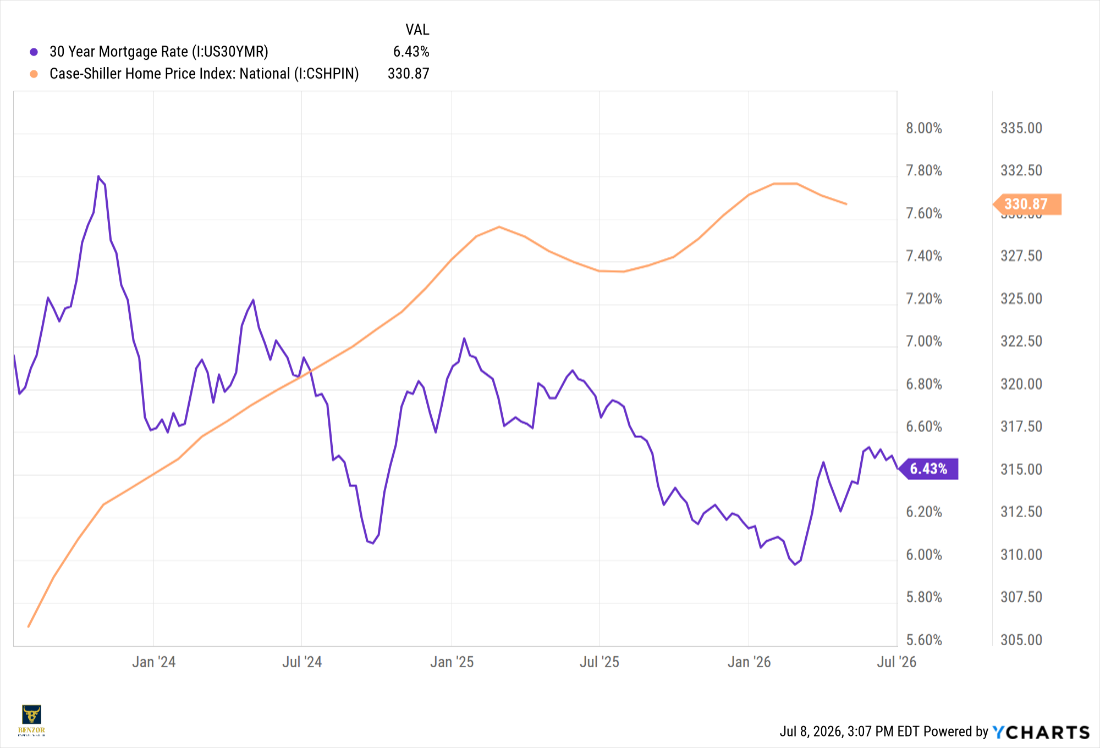
Home prices remained elevated, and mortgage rates stayed high enough to keep monthly payments difficult for the average buyer. The housing affordability issue is not only a price problem or only a rate problem. It is the combination of both. High prices reduce affordability, and high mortgage rates multiply the monthly-payment burden.
Housing Affordability Remained Under Pressure
Source: YCharts
The lock-in effect also kept housing supply tight. Many existing homeowners had low mortgage rates and little incentive to sell if buying again meant taking on a much higher rate. That limited inventory and helped keep home prices firm even while affordability remained weak. The result was a housing market stuck between pressured demand and constrained supply.
Fed Policy and Rate Expectations
The Federal Reserve entered a new phase during the first half with Kevin Warsh becoming Fed Chair. The leadership changes matter because they affect how the Fed communicates, how markets interpret policy signals, and how investors think about the future path of rates. The change did not create an immediate pivot toward easier policy. Instead, it introduced a new communication backdrop while the Fed continued dealing with the same core issue: inflation remaining above target.
At the June FOMC meeting, the Fed kept the federal funds target range unchanged at 3.50%–3.75%. That decision fit the macro data. Inflation was still too high to justify aggressive easing, while the labor market had cooled but had not weakened enough to force immediate policy support.
The June Summary of Economic Projections added an important layer. The distribution of projections leaned modestly hawkish. While the median 2026 projection was reported at 3.8%, participants were divided between maintaining the current range and moving rates higher, suggesting that additional tightening remained a possibility rather than a consensus expectation. The projection pointed to the possibility of one additional rate hike by year-end.
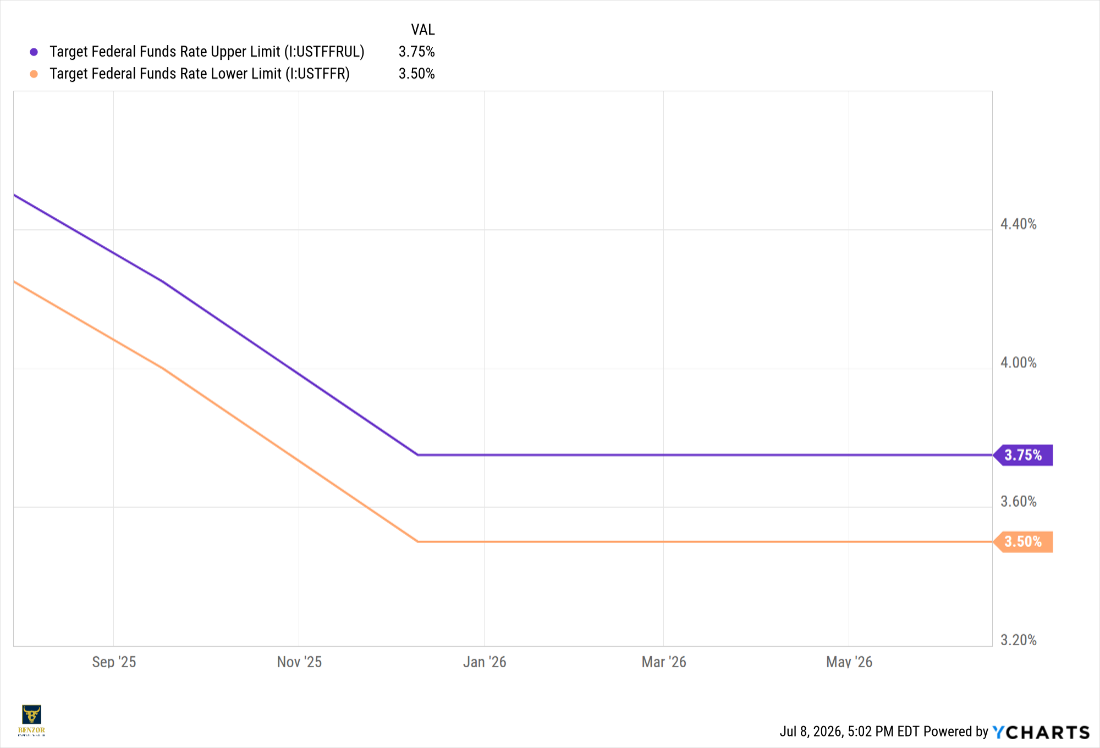
The Fed held rates steady in June, but the projections showed that officials were still concerned about inflation persistence.
The key change under the new chair is also the Fed’s operating and communication style. Chair Warsh announced five task forces focused on areas central to the conduct of monetary policy: Fed communications, the balance sheet, data sources, productivity and jobs, and inflation frameworks
This is important because the market is no longer only watching the next rate decision. Investors are also watching how the Fed explains policy, how much forward guidance it provides, and how it evaluates incoming data. When the Fed gives fewer direct signals about future policy, rate expectations move more quickly around inflation data, labor reports, energy prices, Treasury yields, and Fed commentary.
For current market-implied Fed policy expectations, visit Benzor Capital Wealth and go to Client Resources > Fed Rates Watch.
Geopolitics and Policy Risk
Geopolitical and policy risk remained an important market backdrop during the first half. The most immediate risk came from the Middle East, where the Iran conflict and Strait of Hormuz disruption directly affected oil markets. The ceasefire deal signed in mid-June reduced the immediate stress, but it did not remove the underlying risk. The agreement created a 60-day window to negotiate a broader settlement.
The key issue is that there is still a wide gap between a temporary ceasefire and a durable settlement. Reopening or stabilizing the Strait of Hormuz reduces the immediate supply shock, but the nuclear-program negotiations and broader regional security questions remain separate and more difficult to resolve.
Election-related positioning also became more relevant as the November midterm elections approached. Policy risk tends to rise ahead of major elections because markets begin pricing potential changes in fiscal policy, regulation, trade, taxes, and geopolitical posture. In 2026, affordability, inflation, tariffs, energy prices, and consumer pressure are all politically sensitive issues.
Trade policy remained another major source of uncertainty. Tariffs and trade restrictions continued to affect inflation, corporate margins, and supply chains.
China tensions added another layer of policy risk. China’s decision to restrict additional U.S. companies in response to U.S. defense and technology restrictions showed that the trade conflict is not limited to tariffs. The dispute has expanded into defense, semiconductors, export controls, critical inputs, and restricted-entity lists.
The broader policy risk is that geopolitical shocks, tariffs, and trade restrictions all feed into the same macro channel: inflation. Middle East tensions affect oil. Tariffs affect goods prices. China restrictions affect supply chains and technology inputs.
Together, these factors create a market environment where headline risk remains high and where inflation-sensitive assets, energy prices, Treasury yields, and equity risk appetite can all react quickly to policy developments.
Closing Message
The first half of 2026 reinforced the importance of staying disciplined. Markets performed well in several areas, but the path was not smooth. Equity leadership broadened, fixed income remained challenged by elevated yields, inflation reaccelerated, labor cooled, housing affordability stayed pressured, and geopolitical risk remained active. The market environment rewarded participation, but it also required selectivity.
The key investment message is not to react to every headline. Policy risk, oil volatility, Fed expectations, and election-related uncertainty can all shift market sentiment quickly. Portfolios should be positioned around long-term objectives rather than short-term noise. A disciplined process helps avoid emotional decisions during periods when headlines move faster than fundamentals.
Diversification remains important because the market backdrop is not one-dimensional. U.S. equities benefited from earnings growth and risk appetite; international equities contributed meaningfully; fixed income continued to provide income despite rate volatility; and alternatives can help reduce dependence on traditional market direction.
The first-half rally showed that not all risk assets moved for the same reasons. Areas tied to earnings visibility, quality balance sheets, durable cash flows, and secular growth were better positioned than areas dependent on lower rates or weaker inflation.
Long-term opportunities remain intact. Innovation, productivity growth, infrastructure investment, global diversification, and income generation continue to create attractive investment themes.
The portfolio approach going forward is straightforward: stay invested, stay diversified, and stay selective. Markets will continue to react to inflation data, Fed expectations, geopolitics, and election developments, but long-term outcomes are driven by disciplined planning, quality investments, and consistent portfolio management.